
기존 채팅 시스템에서 카프카를 통해 메시지를 수신하고, Consumer에서 메시지 생성 및 키 수정 후 DB에 저장하고 브로드캐스트하는 방식을 채택했다.
이를 통해 서버가 여러 대로 분산되어 있어도, Kafka가 메시지를 브로드캐스트해주기 때문에 WebSocket 세션과 무관하게 안정적으로 메시지를 수신할 수 있다.
기존 구조 문제점
- 예외 발생 시 메시지 유실
- 예: Redis 저장 중 예외 발생 시 Kafka는 처리가 완료된 것으로 간주하고 offset을 커밋한다.
- 그 결과 메시지는 유실되고, 복구되지 않으며 로그도 남지 않는다.
- 재시도 로직 미존재
- 일시적인 네트워크 오류, Redis 순간 장애 등에도 즉시 실패 처리된다.
- Kafka의 기본 설정으로는 Consumer 수준에서 재시도 처리를 하지 않으며, 직접 구현해야 한다.
- 후속 처리/분석 불가능
- 실패한 메시지의 내용을 저장하거나 추적할 수 없다.
- 이는 장애 분석, 관리자 수동 처리, 메시지 복구 등에 심각한 제약이 된다.
해결책
이러한 문제들을 해결하고자 아래와 같은 방법들을 구현할 수 있다.
- Kafka Consumer에서 예외 발생 시 최대 N회 재시도
- Spring Kafka의
DefaultErrorHandler를 활용 - 예외 발생 시
backOff를 주고, 지정 횟수까지 재시도
- Spring Kafka의
- 재시도에도 실패한 메시지는 Dead Letter Queue(DLQ)로 전송
DeadLetterPublishingRecoverer를 사용하여.DLT토픽으로 메시지 분기
- DLQ로 보낸 메시지는 Kafka Exporter를 통해 메트릭화하고, Prometheus → Grafana로 시각화 가능
- 실패 시점과 원인을 Trace 로그로 남김
backOff?
Kafka Consumer에서 예외가 발생했을 때 바로 다음 메시지를 처리하는 대신, 일정 시간 간격을 두고 재시도할 수 있도록 하는 설정.
DLQ (Dead Letter Queue)
잘못된 메시지 및 실패한 메시지의 임시 저장소 역할이다.
카프카에서는 재시도에도 실패한 메시지를 다른 토픽으로 분기하여, 나중에 수동 처리하거나 장애 분석, 재처리를 가능하게 만드는 구조로 사용될 수 있다.
Spring Kafka에 관련 기능이 존재하고, DLQ 전용 토픽이 생성되며 실패한 메시지의 원인, 파티션 정보 등이 함께 저장된다.
구현
Kafka Consumer에서 예외 발생 시 재시도, 재시도에도 실패 시 DLQ로 전송하는 구조를 구현해보자.
KafkaConsumerConfig 클래스 작성
1
2
3
4
5
6
7
8
9
10
11
12
13
14
15
16
17
18
19
20
21
22
23
24
25
26
27
28
29
30
31
32
33
34
35
@Configuration
@RequiredArgsConstructor
@Slf4j
public class KafkaConsumerConfig {

    private final KafkaTemplate<String, Object> kafkaTemplate;

    @Bean
    public ConcurrentKafkaListenerContainerFactory<String, Object> kafkaListenerContainerFactory(
            ConsumerFactory<String, Object> consumerFactory) {

        ConcurrentKafkaListenerContainerFactory<String, Object> factory = new ConcurrentKafkaListenerContainerFactory<String, Object>();
        factory.setConsumerFactory(consumerFactory);

        factory.setCommonErrorHandler(errorHandler());

        return factory;
    }

    @Bean
    public DefaultErrorHandler errorHandler() {
        FixedBackOff backOff = new FixedBackOff(1000L, 3L);

        var recoverer = new DeadLetterPublishingRecoverer(
                kafkaTemplate,
                (record, ex) -> {
                    log.error("DLQ 전송: topic={}, partition={}, value={}",
                            record.topic(), record.partition(), record.value(), ex);
                    return new TopicPartition(record.topic() + ".DLT", record.partition());
                }
        );

        return new DefaultErrorHandler(recoverer, backOff);
    }
}
- Spring Kafka의 ErrorHandler와 Recoverer 커스터마이징을 위한 클래스. Kafka Listener에 자동으로 적용되도록 설정한다.
- @KafkaListener가 붙은 메서드는 KafkaListenerContainerFactory인 빈이 있다면 그 설정을 따라간다.
- Kafka Listener Factory
- 카프카 리스너 컨테이너 팩토리를 직접 구성
- 이 팩토리를 통해 KafkaListener의 동작 방식을 커스터마이징 가능하다.
- ErrorHandler를 전체 Listener에 적용해주고 있다.
- ErrorHandler
- 첫 실패 후 1초 간격으로 최대 3번 재시도하도록 backOff 설정
- 실패한 메시지를 DLQ 토픽의 같은 파티션으로 보낸다.
- DeadLetterPublishingRecoverer
- record는 Kafka에서 처리 실패한 단일 메시지를 의미한다.
DLQ 같은 파티션으로 보내는 이유?
파티션은 토픽을 나누는 최소 단위이다. 각 컨슈머 인스턴스는 특정 파티션을 할당받아 메시지를 읽는다. 파티션은 병렬 처리가 가능하다.
DLQ에 보낼 때 같은 파티션으로 보내고 있다.
chat-topic의 0번 파티션에서 터진 메시지는 chat-topic.DLT의 0번 파티션에 쌓이도록 하는 것.
- 추적성
- 장애 발생한 메시지를 원래 어떤 파티션에서 어떤 offset으로 처리하다 실패했는지 추적이 가능.
- DLQ의 로그만 보고 어디서 실패했는지 명확히 알 수 있다.
- 순서 보존
- Kafka는 같은 파티션 내에서 메시지 순서를 보장한다.
- 동일한 key의 메시지가 순서대로 처리되다가 3번째에서 실패한다면 DLQ도 동일 파티션, 순서대로 저장된다.
- 재처리시 순서가 뒤섞이지 않게 할 수 있다.
- Replay
- 장애 복구 후 DLQ 토픽을 다시 소비해 원래 토픽으로 replay할 수 있다.
- chat-topic.DLT를 다시 읽어 chat-topic에 넣는다.
- 이 때 같은 파티션이라면 replay시 원래 메시지 흐름 구조가 유지될 수 있다.
- 장애 복구 후 DLQ 토픽을 다시 소비해 원래 토픽으로 replay할 수 있다.
현재 우리 서비스에서 보자면 설정에 따라 다르지만, 1:1 채팅방 하나를 하나의 파티션에 매핑할 수 있다. 같은 채팅방 메시지를 같은 파티션으로 보내는 것.
- 간단 정리
- 브로커 (카프카 서버)
- 장애 복구 역할
- 컨슈머 (컨슈머 인스턴스, 설정으로 하나의 서버에서 여러개 인스턴스 가능)
- 파티션의 메시지를 읽어오고 성능에 주요한 작용. 병렬 처리량을 컨슈머 수가 결
- 파티션 (1컨슈머가 1파티션을 처리)
- 카프카 메시지를 쪼개 병렬로 처리하는 단위
- 브로커 (카프카 서버)
1
2
3
4
5
6
7
8
9
[Kafka 클러스터]
 ├─ 브로커 1 (chat-topic-0, chat-topic-3)
 ├─ 브로커 2 (chat-topic-1, chat-topic-4)
 └─ 브로커 3 (chat-topic-2, chat-topic-5)

[컨슈머 그룹: chat-group]
 ├─ 컨슈머 1 → 파티션 0, 3
 ├─ 컨슈머 2 → 파티션 1, 4
 └─ 컨슈머 3 → 파티션 2, 5
Retry -> DLQ 테스트 체크
1
2
3
if ("fail".equalsIgnoreCase(message.getMessageText())) {
  throw new RuntimeException("실패 유도");
}
기존 Consumer에 fail 메시지를 보냈을 때 예외를 던지도록 하는 코드를 추가해준다.
1
2
3
4
@KafkaListener(topics = "chat-topic.DLT", groupId = "chat-dlq-group")
public void consumeDlq(ChatMessageDto message) {
  log.warn("DLQ에서 받은 메시지: {}", message);
}
그리고 리스너를 하나 더 만들어서 DLQ에 있는 메시지를 로그로 나타낸다.
이렇게 설정 후 “fail” 메시지를 보내고 로그를 확인해보자.
1
2
3
4
INFO 27784 --- [Dangdang Salon Server] [rver-producer-1] c.d.d.c.util.KafkaChatMessageProducer    : topic chat-topic에 메시지 전달 성공: com.dangdangsalon.domain.chat.dto.ChatMessageDto@6ffd6a19
INFO 27784 --- [Dangdang Salon Server] [ntainer#0-0-C-1] c.d.d.c.util.KafkaChatMessageConsumer    : Kafka에서 받은 메시지: com.dangdangsalon.domain.chat.dto.ChatMessageDto@70f74e88
INFO 27784 --- [Dangdang Salon Server] [ntainer#0-0-C-1] o.a.k.c.c.internals.LegacyKafkaConsumer  : [Consumer clientId=consumer-chat-group-2, groupId=chat-group] Seeking to offset 1 for partition chat-topic-2
ERROR 27784 --- [Dangdang Salon Server] [ntainer#0-0-C-1] o.s.k.l.KafkaMessageListenerContainer    : Error handler threw an exception
- DefaultErrorHandler가 예외를 감지하고 seek() 메서드를 통해 이전 메시지를 다시 읽도록 요청한다.
- 1초 간격으로 총 3회 재시도 중 1회라는 뜻
- Seeking to offset 1 for partition chat-topic-2
이렇게 3회 재시도를 반복한 후 DLQ로 전송하는 것을 확인할 수 있다.
1
2
3
4
5
INFO 27784 --- [Dangdang Salon Server] [ntainer#0-0-C-1] c.d.d.c.util.KafkaChatMessageConsumer    : Kafka에서 받은 메시지: com.dangdangsalon.domain.chat.dto.ChatMessageDto@3848dd3
ERROR 27784 --- [Dangdang Salon Server] [ntainer#0-0-C-1] c.d.config.KafkaConsumerConfig           : DLQ 전송: topic=chat-topic, partition=2, value=com.dangdangsalon.domain.chat.dto.ChatMessageDto@3848dd3

WARN 27784 --- [Dangdang Salon Server] [ntainer#0-0-C-1] o.s.k.l.DeadLetterPublishingRecoverer    : Destination resolver returned non-existent partition chat-topic.DLT-2, KafkaProducer will determine partition to use for this topic
WARN 27784 --- [Dangdang Salon Server] [ntainer#1-0-C-1] c.d.d.c.util.KafkaChatMessageConsumer    : DLQ에서 받은 메시지: com.dangdangsalon.domain.chat.dto.ChatMessageDto@23d5563d
- 3회 재시도가 끝나고, DeadLetterPublishingRecoverer가 호출된다.
- DLQ 전송: topic=chat-topic, partition=2, value=com.dangdangsalon.domain.chat.dto.ChatMessageDto@3848dd3
- 문제가 발생한 메시지가 무엇인지, 토픽이 무엇인지 어떤 파티션에서 실패했는지를 모두 확인할 수 있다.
- Destination resolver returned non-existent partition chat-topic.DLT-2, KafkaProducer will determine partition to use for this topic
- recoverer에서 파티션 2를 사용하려 했지만 DLT 토픽에 파티션 2가 존재하지 않아 KafkaProducer가 자동으로 파티션을 선택해 메시지를 DLT 토픽에 전송 (경고 로그)
- 최종적으로 DLQ에 메시지가 제대로 저장되었음을 볼 수 있다.
트레이싱 / 시각화
이제 이렇게 만들어둔 구조를 더 파악하기 쉽게 트레이싱을 추가해보자.
Kafka Consumer가 메시지를 처리할 때 해당 메시지가 어떤 흐름을 따라왔는지 추적할 수 있으면 편리하다.
Spring Sleuth, 도커로 세팅해둔 Jaeger를 사용한다.
기존에 내가 AOP로 로그를 작성했던 것과 비슷하다. 차이는 내 로그도 흐름을 추적할 순 있지만 Controller, Service, Repository 단에 한정된다. Sleuth는 분산 시스템 전반에 걸친 흐름을 자동으로 추적한다. 여러 서버가 상호작용하는 경우에도 추적이 가능하다. 또 이러한 전체 요청 맥락을 Jaeger같은 외부 시스템에도 연동 가능하게 할 수 있다는 점이 달라 도입하고자 한다.
Sleuth -> Micrometer Tracing
Spring에서 사용하는 분산 트레이싱 도구이다.
- Request -> 서비스 흐름 (Log, DB, Kafka 등등) -> 응답 흐름을 추적할 수 있다.
- Kafka 같은 서비스는 따로 exporter가 필요할 수 있다.
- Trace Id와 Span ID를 자동 생성하고 전파한다.
- 전파를 통해 MSA 환경에서도 흐름에 대한 일종의 발자취를 남길 수 있다.
- 각 로그마다 어떤 요청에 해당하는지 파악할 수 있다.
Spring Boot 3.x 부터 Sleuth에서 Micrometer Tracing 체계로 바뀌었다.
참고: https://huisam.tistory.com/entry/micrometer-tracing#google_vignette
Jaeger
Sleuth만 쓴다면 로깅 강화 정도에 그친다. Jaeger를 사용해 시각화를 해줘야 한다.
Jaeger는 데이터를 시각화하는 시스템으로 보면 된다.
- Collector: trace 수집
- Query: trace 조회 (그라파나 연동 가능)
- UI: 웹 인터페이스
Gradle 의존성 추가
1
2
3
implementation 'org.springframework.boot:spring-boot-starter-actuator'
implementation 'io.micrometer:micrometer-tracing-bridge-brave'
implementation 'io.zipkin.reporter2:zipkin-reporter-brave'
- bridge-brave: Sleuth 스타일로 trace ID, span ID 자동 생성
- zipkin-reporter-brave: Jaeger에 Trace 전송 역할
application.properties
1
2
3
4
5
6
7
8
9
10
11
# 기본 Actuator 설정
management.endpoints.web.exposure.include=*
management.endpoint.health.show-details=always

# Tracing 활성화
management.tracing.enabled=true
management.tracing.sampling.probability=1.0

# Jaeger (Zipkin 프로토콜 사용)
management.zipkin.tracing.endpoint=http://localhost:9411/api/v2/spans
management.zipkin.tracing.enabled=true
1
2
3
4
jaeger:
  image: jaegertracing/all-in-one:1.72
  ports:
    - "9411:9411"   # Zipkin endpoint
- docker-compose 파일에 9411 포트를 열어야한다.
- Jaeger 전송 위함. (Sleuth -> Micrometer Tracing)
설정 후 테스트

localhost:16686으로 접속하면 UI가 나타나고, 실행이 정상적으로 됐다면 Service에 Spring Server 이름이 나타난다.
그리고 API들이 나타나고 해당 API를 눌렀을 때 위와 같이 추적을 할 수 있다.
단순 채팅보내기를 테스트해보았다.
- 5개의 Span이 보인다.
- post api
- security filterchain
- authorize request
- secured request
- security filterchain after
단, 현 상태로는 보다시피 내부 동작인 메시지 Redis 저장이나 Kafka Consume 처리 같은 부분은 명확하게 볼 수 없다.
원하는대로 시각화를 하고 싶다면 원하는 메서드에 @NewSpan(“SaveMessageRedis”)와 같이 애노테이션을 붙여주거나 Tracer를 이용해 직접 Span을 열어줄 수 있다.
NewSpan 애노테이션을 붙인 후 상태를 보자.
그래도 똑같다.
해결
Micrometer Tracing은 HTTP 요청 시 자동으로 TraceContext를 헤더에 넣어 전파하지만, Kafka 메시지에는 기본적으로 trace id같은 정보가 자동 전파되지 않는다.
따라서 중간에 TraceContext없이 실행되고 있는 것이고, 상위 Span이 없어 NewSpan 애노테이션을 달아도 고아 Span이 되고 버려져 똑같은 실행 결과가 나타난 것이다.
1
2
spring.kafka.template.observation-enabled=true
spring.kafka.listener.observation-enabled=true
1
2
3
4
5
6
7
8
9
10
11
@Bean
public ConcurrentKafkaListenerContainerFactory<String, Object> kafkaListenerContainerFactory(
     ConsumerFactory<String, Object> consumerFactory) {

     ConcurrentKafkaListenerContainerFactory<String, Object> factory = new ConcurrentKafkaListenerContainerFactory<String, Object>();

	 //...

     factory.getContainerProperties().setObservationEnabled(true);
     return factory;
}
이렇게 전파가 가능한 옵션들을 추가해주면 된다.
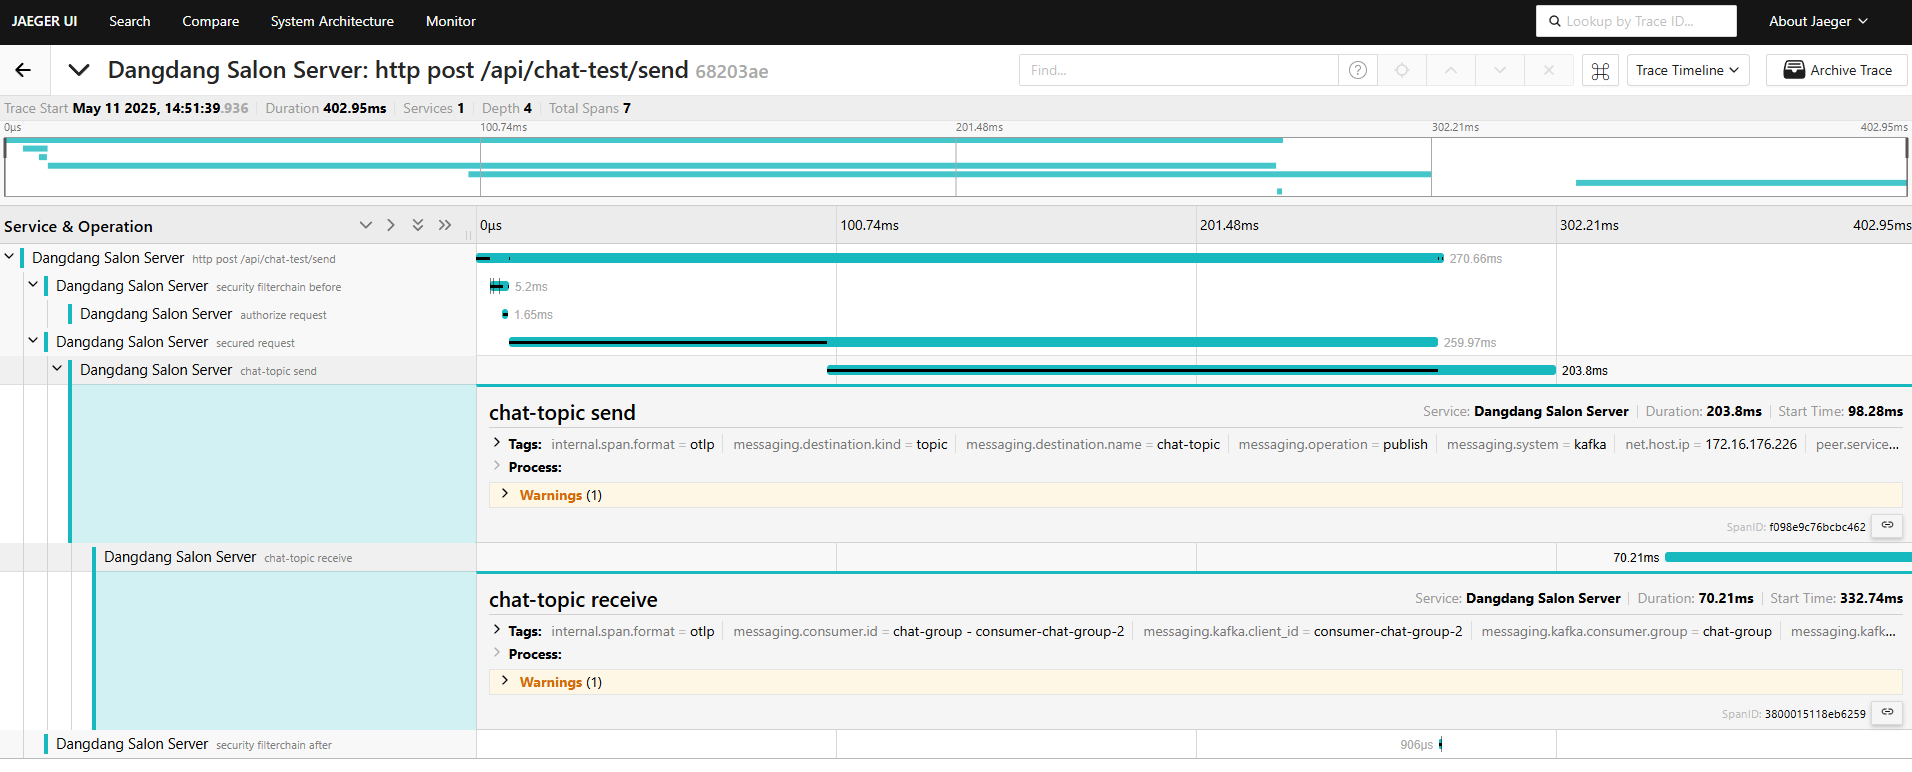
Http 요청도 추적하면서 중간에 Kafka 메시지를 보내고 받는 부분까지 추적이 가능해졌다.
전체 트레이싱 장점
- 트레이싱을 통해 흐름이 하나의 트랜잭션처럼 시각화된다.
- 장애나 지연 원인을 정확하게 파악할 수 있다.
- 어떤 컴포넌트에서 얼마나 걸렸는지 숫자로 확인이 가능하다.
- 어떤 서비스에서 예외 터졌는지 Span 안에 표시된다.
- Kafka 같이 분리된 비동기 시스템에서도 트랜잭션처럼 보여 한 눈에 추적이 가능하다.
Replay API 구현
위에서 DLQ에 재시도까지 실패한 메시지들을 쌓아놓는 구조를 만들었다.
이제 DLQ에 있는 메시지를 처리하는 부분들을 구현해야 한다.
어떻게 구현해야 할까?
- Kafka DLQ의 메시지를 직접 가져와 Replay
- DLQ는 단순 메시지 저장소이다. 조회와 검색이 어렵다.
- 조회를 하려면 컨슈머를 따로 구현하여 consume 해야 한다.
- 재처리 범위를 선택하기 어렵다. offset을 계산해야 한다.
- 특정 offset부터 메시지를 소비하려면 여러 설정들이 복잡하게 이루어져야 한다.
- 또 메시지 유지 기간이 지나고 Replay를 할 경우 DLQ에서도 메시지가 삭제된다.
- 더해 어떤 메시지가 실패했고, 왜 실패했는지 추적하고 분석하기 어려워질 수 있다는 뜻.
따라서 DLQ의 메시지를 따로 저장할 수 있는 저장공간이 필요하다.
DLQ의 메시지를 MongoDB에 저장해두고, Replay API를 통해 MongoDB의 메시지를 기반으로 Replay를 하면 된다.
왜 MongoDB?
결국 메시지를 저장하는 용도라면 Redis, S3, MySQL 등등의 후보가 있을 수 있다. 하지만 MongoDB가 가장 적합하다고 본다.
- Kafka 메시지는 대부분 JSON 형태이다. MongoDB는 스키마 변경 없이 그대로 저장할 수 있다.
- 검색이 쉽고 비정형 로그에 강하다.
DLQ 메시지 MongoDB 저장
- MongoDB Document 설계
1
2
3
4
5
6
7
8
9
10
11
12
13
14
15
16
17
18
19
20
21
22
23
24
25
26
27
28
29
@Getter
@Document(collection = "chat_message_dlq")
public class FailedChatMessage {

    @Id
    private String id;

    private String roomId;
    private String message;
    private String exception;
    private LocalDateTime failedAt;
    private boolean replayed;

    private String topic;
    private int partition;

    @Builder
    public FailedChatMessage(String id, String roomId, String message, String exception, LocalDateTime failedAt,
                             boolean replayed, String topic, int partition) {
        this.id = id;
        this.roomId = roomId;
        this.message = message;
        this.exception = exception;
        this.failedAt = failedAt;
        this.replayed = replayed;
        this.topic = topic;
        this.partition = partition;
    }
}
- MongoRepository
1
2
3
public interface FailedChatMessageRepository extends MongoRepository<FailedChatMessage, String> {
     List<FailedChatMessage> findByRoomIdAndReplayedFalse(String roomId);
}
- KafkaConsumer (DLQ)
1
2
3
4
5
6
7
8
9
10
11
12
13
14
15
16
17
18
19
@KafkaListener(topics = "chat-topic.DLT", groupId = "chat-dlq-consumer")
public void consumeDlqMessage(String message, @Header(KafkaHeaders.RECEIVED_TOPIC) String topic,
                                  @Header(KafkaHeaders.RECEIVED_PARTITION) int partition,
                                  @Header(KafkaHeaders.EXCEPTION_MESSAGE) String exception) {

    log.warn("DLQ 수신: message={}, exception={}", message, exception);

    FailedChatMessage msg = FailedChatMessage.builder()
                .roomId(extractRoomId(message))
                .message(message)
                .exception(exception)
                .topic(topic)
                .partition(partition)
                .failedAt(LocalDateTime.now())
                .replayed(false)
                .build();

    repository.save(msg);
}
DLQ의 메시지를 소비하는 컨슈머를 만들어, 해당 메시지들을 바로바로 MongoDB에 백업하는 형태를 구현한다.
Replay API 구현
Replay를 구현하는 방법은 다양하게 있겠지만, 우선 간단하게 테스트해보기 위해 미처리된 메시지들을 처리하는 API를 구현하는 방식으로 구현해본다.
- 채팅 메시지 처리 중 실패 -> DLQ -> MongoDB 저장
- Replay API 호출 -> chat-topic으로 재전송
- Kafka -> Redis -> STOMP BroadCast 흐름이 정상적으로 동작하는지 체크
- MongoDB의 처리된 메시지 replayed 가 true로 갱신됐는지 체크
이러한 흐름으로 이어져야 한다.
Replay API는 목적에 따라 Partition 전체의 실패 메시지들을 처리하는 API를 만들 수 있고, 혹은 ID별로 접근해 메시지들을 처리하는 API를 만들 수 있는 등 다양하게 구현할 수 있다.
각 방법은 그렇게 어렵다거나 크게 다르지 않으니 ID로 접근해 처리하는 방식을 우선 구현해보려고 한다.
일반 API들과 크게 다르지 않다. 기존 토픽으로 재전송해주면 된다.
로직이 단순한 것은 재시도 3번까지 실패한 경우 다른 부분에서 문제가 있다는 것이고, 이 API를 실행할 땐 개발자가 당시 문제를 파악하고 해결한 후 복구용도로 이 API를 실행하는 것이기 때문이다.
- Service
1
2
3
4
5
6
7
8
9
10
11
12
13
14
15
16
17
18
@Service
@RequiredArgsConstructor
public class MessageReplayService {

    private final FailedChatMessageRepository repository;
    private final KafkaTemplate<String, String> kafkaTemplate;

    public void replayById(String id) {
        FailedChatMessage failedChatMessage = repository.findById(id)
                .orElseThrow(() -> new IllegalArgumentException("Replay 대상 메시지를 찾을 수 없습니다."));

        kafkaTemplate.send(failedChatMessage.getTopic().replace(".DLT", ""), failedChatMessage.getRoomId(),
                failedChatMessage.getMessage());

        failedChatMessage.updateReplayed(true);
        repository.save(failedChatMessage);
    }
}
프로메테우스 커스텀 메트릭 만들기 (Kafka, Redis)
- Kafka 기반 시스템에서 안정적인 운영을 위해서는 DLQ 메시지 수신, 재처리 성공 여부, Redis 처리 실패 등 다양한 이벤트를 메트릭으로 수집하고 시각화해야 한다. 이를 통해 장애 징후를 조기 감지하거나 재처리 자동화 트리거 등으로 연결할 수 있다.
이러한 메트릭 정보들을 커스텀해서 만들 수 있다.
DLQ Counter
1
2
3
4
5
6
7
8
9
10
11
12
13
14
15
16
17
18
19
20
21
22
23
24
25
26
27
28
29
30
31
32
33
34
35
36
37
38
39
40
41
42
43
44
45
@Slf4j
@Component
public class KafkaChatDlqConsumer {

    private final FailedChatMessageRepository repository;
    private final Counter dlqCounter;

    public KafkaChatDlqConsumer(MeterRegistry registry, FailedChatMessageRepository repository) {
        this.repository = repository;
        this.dlqCounter = Counter.builder("chat_message_dlq_count")
                .description("DLQ 수신 메시지 수")
                .register(registry);
    }

    @KafkaListener(topics = "chat-topic.DLT", groupId = "chat-dlq-consumer")
    public void consumeDlqMessage(String message, @Header(KafkaHeaders.RECEIVED_TOPIC) String topic,
                                  @Header(KafkaHeaders.RECEIVED_PARTITION) int partition,
                                  @Header(KafkaHeaders.EXCEPTION_MESSAGE) String exception) {

        log.warn("DLQ 수신: message={}, exception={}", message, exception);
        dlqCounter.increment();

        FailedChatMessage msg = FailedChatMessage.builder()
                .roomId(extractRoomId(message))
                .message(message)
                .exception(exception)
                .topic(topic)
                .partition(partition)
                .failedAt(LocalDateTime.now())
                .replayed(false)
                .build();

        repository.save(msg);
    }

    private String extractRoomId(String message) {
        try {
            JsonNode node = new ObjectMapper().readTree(message);
            return node.get("roomId").asText();
        } catch (Exception e) {
            log.warn("roomId 추출 실패: {}", message);
            return "unknown";
        }
    }
}
- 프로메테우스에 등록되는 커스텀 카운터 메트릭 객체를 만든다.
- 마이크로미터의 MeterRegistry를 주입받아 Counter를 등록하는 방식.
- description은 그라파나에서 볼 수 있는 설명 텍스트이다.
- DLQ 메시지를 수신하면 increment()를 통해 프로메테우스 지표 값을 1 증가시킨다.
이러한 방식으로 커스텀 메트릭을 만들 수 있다.
그라파나는 대시보드만 연동하면 되므로 프로메테우스 메트릭으로 간단히 확인한다.
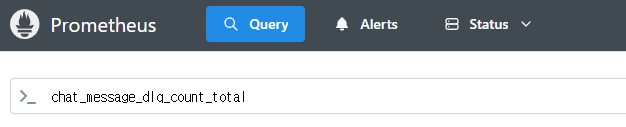
이런식으로 메트릭이 생겨난 것을 볼 수 있다.
Replay 성공 카운터
1
2
3
4
5
6
7
8
9
10
11
12
13
14
15
16
17
18
19
20
21
22
23
24
25
26
27
28
29
30
31
32
33
34
35
36
37
@Slf4j
@Service
public class MessageReplayService {

    private final FailedChatMessageRepository repository;
    private final KafkaTemplate<String, String> kafkaTemplate;
    private final Counter replaySuccessCounter;

    public MessageReplayService(MeterRegistry registry,
                                FailedChatMessageRepository repository,
                                KafkaTemplate<String, String> kafkaTemplate) {
        this.repository = repository;
        this.kafkaTemplate = kafkaTemplate;
        this.replaySuccessCounter = Counter.builder("chat_message_replay_success_total")
                .description("Replay 성공 횟수")
                .register(registry);
    }

    public void replayById(String id) {
        FailedChatMessage failedChatMessage = repository.findById(id)
                .orElseThrow(() -> new IllegalArgumentException("Replay 대상 메시지를 찾을 수 없습니다."));

        kafkaTemplate.send(
                failedChatMessage.getTopic().replace(".DLT", ""),
                failedChatMessage.getRoomId(),
                failedChatMessage.getMessage()
        );

        replaySuccessCounter.increment();

        failedChatMessage.updateReplayed(true);
        repository.save(failedChatMessage);

        log.info("Replay 성공: id={}, roomId={}", id, failedChatMessage.getRoomId());
    }
}
정리
이처럼 Micrometer + Prometheus를 통해 Kafka, Redis, MongoDB 흐름의 핵심 구간에 메트릭을 심으면 그라파나 기반의 실시간 대시보드 구성, Slack/Email 알림 연동 등 운영 자동화 시스템으로 확장할 수 있다.
- rate(chat_message_dlq_count[5m])
- 5분간 DLQ 증가 속도를 뜻한다.
- 이렇게 메트릭을 응용해 알림 조건에 활용 가능하다.